AnyStock Stock and Financial JS Charts 8.7.0
Free Trial Version
Publisher Description
AnyChart Stock and Financial JS Charts (short: AnyStock) is a JavaScript based financial and stock charting library, also used for visualizing any timeline data over a long time. AnyStock technology turns your real-time data into highly sophisticated charts with interactive features, bringing visualization of your data to the Web and providing a full feature set for creating real-time streaming and data manipulation applications.
Designed to display date and time based information, AnyStock is the ideal tool for client reporting and performance reporting applications. Reports and Dashboards are visualized with scrolling, drill downs, panning and zoom functionality available in all of our HTML5 charts. AnyStock brings analysis of your FOREX, commodity and investment market data to life. The ability to review long term and large data sets can easily be handled with scroll, pan, and zoom controls.
AnyStock is fully integrated into AnyChart 7 Framework and shares most of its ideology, settings technique and ease of use - and you can use AnyStock along other charts including those available in the AnyChart JavaScript Charts, AnyGantt JavaScript Gantt Charts, and AnyMap JavaScript Maps.
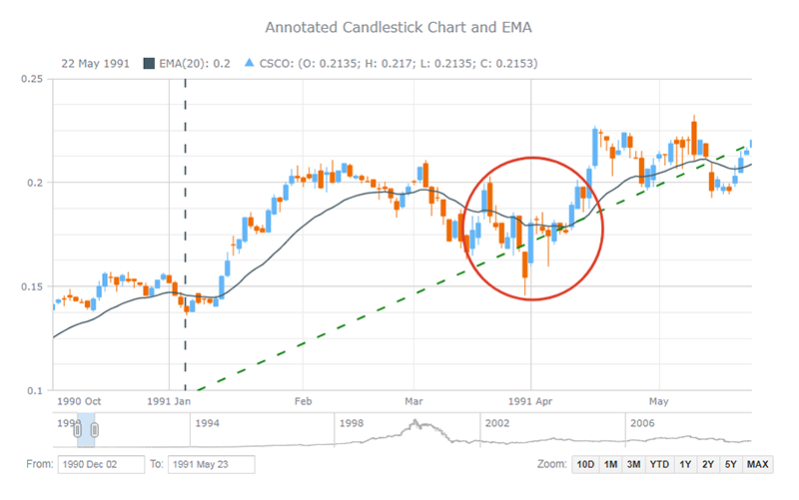
AnyStock supports a wide range of stock chart types (including Candlestick, OHLC, Line, Spline, Column, Step Line, Area, Step Area, Spline Area, Marker, Range Column, Range Area, Range Spline Area, Stacked Stock JS charts) and technical analysis indicators (MACD, ROC, RSI, SMA, EMA, DMI, CHO, CCI, and others; customs indicators can be set up). Drawing tools (including Line segment, Ray, Trend line, Trend channel, Andrew's pitchfork, Fibonacci fan, Buy/Sell signals, and many others) and adding of news events (analyst opinions, insider trading, dividends, and key developments) to improve the ability to analyze information effectively are also available and have made an important contribution to the superfast HTML5 visualization of stock/financial or any timeline data w/ AnyStock JS.
About AnyStock Stock and Financial JS Charts
AnyStock Stock and Financial JS Charts is a free trial software published in the Java & JavaScript list of programs, part of Web Development.
This Java & JavaScript program is available in English, Arabic, Chinese, German, Japanese, Portuguese, Russian, Spanish. It was last updated on 05 March, 2024. AnyStock Stock and Financial JS Charts is compatible with the following operating systems: Android, Ios, Linux, Mac, Other, Windows.
The company that develops AnyStock Stock and Financial JS Charts is AnyChart JavaScript Charts. The latest version released by its developer is 8.7.0.
The download we have available for AnyStock Stock and Financial JS Charts has a file size of 17.83 MB. Just click the green Download button above to start the downloading process. The program is listed on our website since 2019-08-08 and was downloaded 110 times. We have already checked if the download link is safe, however for your own protection we recommend that you scan the downloaded software with your antivirus. Your antivirus may detect the AnyStock Stock and Financial JS Charts as malware if the download link is broken.
How to install AnyStock Stock and Financial JS Charts on your Windows device:
- Click on the Download button on our website. This will start the download from the website of the developer.
- Once the AnyStock Stock and Financial JS Charts is downloaded click on it to start the setup process (assuming you are on a desktop computer).
- When the installation is finished you should be able to see and run the program.
